February 2025
Feature Updates
Amazon Selling Partner API
DataChannel’s Amazon Selling Partner API connector now supports 1 new forward data pipelines. The new and existing pipelines of the Amazon Selling Partner API connector can be accessed from the ETL tab on the Sidebar in the DataChannel UI.
Please follow the step-by-step Set up Guide for a smooth integration of the pipelines.
TikTok Ads
DataChannel’s TikTok Ads connector now supports a new forward data pipeline. The new and existing pipelines of the TikTok Ads connector can be accessed from the ETL tab on the Sidebar in the DataChannel UI.
Please follow the step-by-step Set up Guide for a smooth integration of the pipelines.
Logs
DataChannel’s Logs connector now supports a new forward data pipeline. The new and existing pipelines of the Logs connector can be accessed from the ETL tab on the Sidebar in the DataChannel UI.
Please follow the step-by-step Set up Guide for a smooth integration of the pipelines.
Apple Search Ads
The Apple Search Ads connector has now been upgraded to support the API version(v5) uprgade.
In the new version, new metrics have been added to the following pipelines:
-
Campaigns -
creationTime,supplySources -
Adgroups -
paymentModel -
GeoLocations -
adminArea,countryOrRegion,locality -
Daily Performance Report -
totalAvgCPI,totalInstallRate,totalInstalls,totalNewDownloads,totalRedownloads,viewInstalls,viewNewDownloads,viewRedownloads -
Hourly Performance Report -
totalAvgCPI,totalInstallRate,totalInstalls,totalNewDownloads,totalRedownloads,viewInstalls,viewNewDownloads,viewRedownloads
Also, please note that some metrics have been renamed in the following pipelines:
-
Daily Performance Report -
-
avgCPAhas been renamed totapInstallCPI -
conversionRatehas been renamed totapInstallRate -
installshas been renamed totapInstalls -
newDownloadshas been renamed totapNewDownloads -
redownloadshas been renamed totapRedownloads
-
-
Hourly Performance Report -
-
avgCPAhas been renamed totapInstallCPI -
conversionRatehas been renamed totapInstallRate -
installshas been renamed totapInstalls -
newDownloadshas been renamed totapNewDownloads -
redownloadshas been renamed totapRedownloads
-
Users are advised to reconfigure their existing pipelines to ensure error free running.
Connector Setup
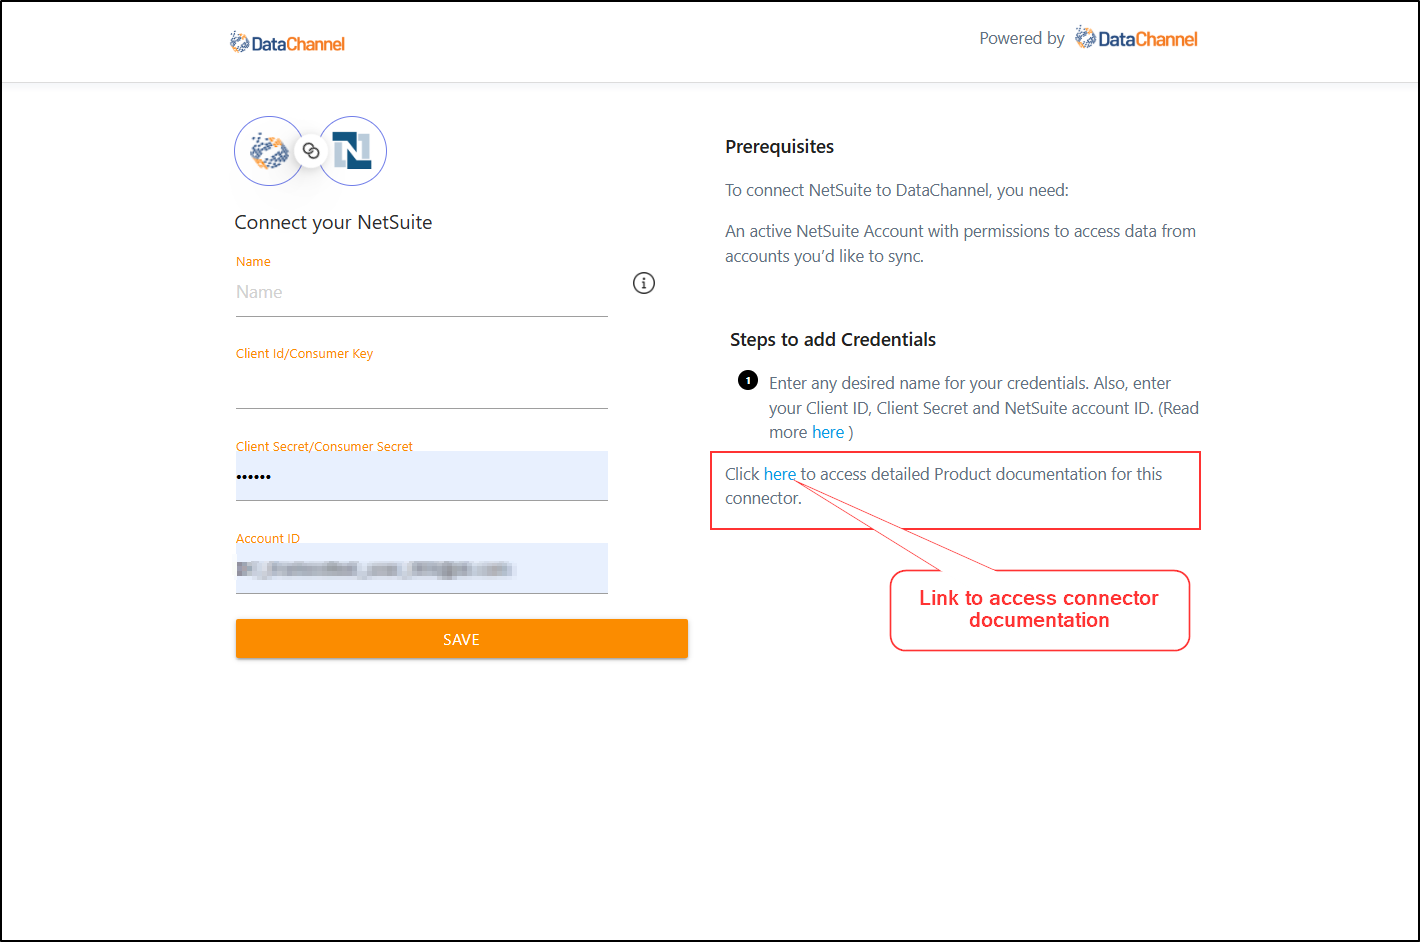
For the convinience of Users, detailed steps for credential addition have now been displayed on the Console itself. Here, you will also find a link to directly access the respective connector documentation.
Blinkit
For Blinkit connector, Upsert mode has been added for configuring the Sales Report pipeline. If you have this pipeline scheduled, you are advised to re-visit and check the pipeline configurations for smooth functioning.
Storage Connectors
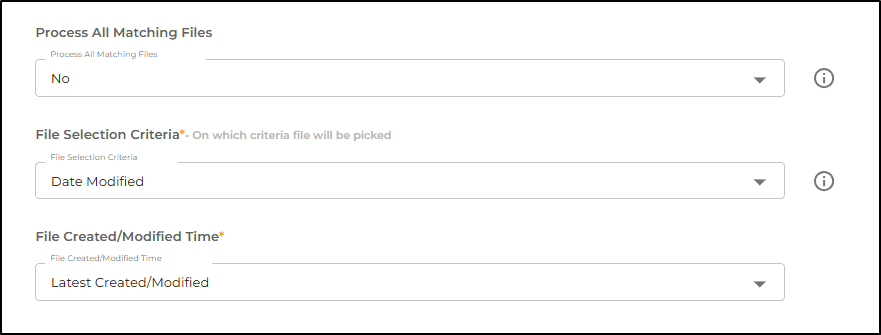
For the Storage connectors (namely Amazon S3, Azure Blob Storage, Box, Files, FTP, Google Drive, Google Cloud storage), if you do not want to process all matching files, you can now specify file selection criteria. When configuring the pipeline, you can use these fields to specify if you want to fetch files pertaining to a certain time frame.
Unicommerce
Earlier, users had to manually key in the the facility code for the Report exports pipeline. This has now been changed to enable users to select the desired Facility code(s) from those listed in the dropdown.
Ask Neo
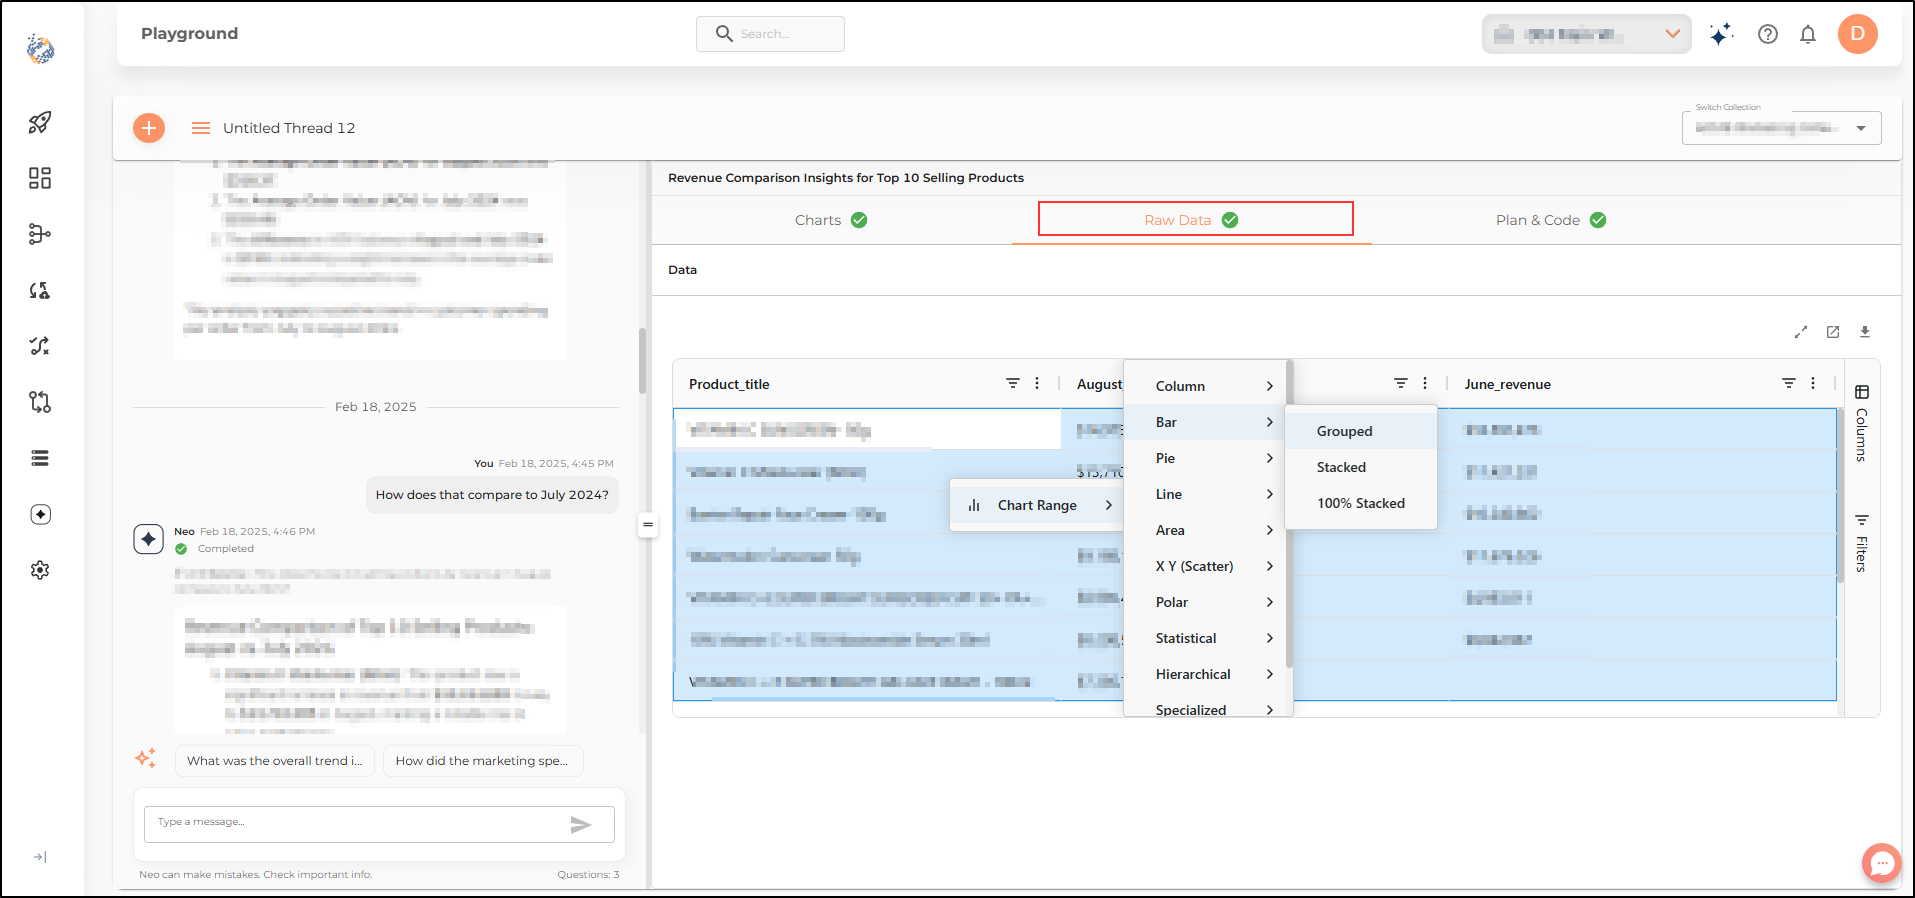
Users can now create any desired graphs from the Raw data response generated by Ask Neo. To access this functionality, once Neo has generated a response to your Query, go to the Raw Data tab, and select the data range you want to generate the graphic for. Then Right click to display the types of different charts available and choose an appropriate chart type. Once the desired chart is generated, you may customise and copy it as per your requirements.
Still have Questions?
We’ll be happy to help you with any questions you might have! Send us an email at info@datachannel.co.
Subscribe to our Newsletter for latest updates at DataChannel.